Persistent bearish forces from two weeks ago continue to impact the cryptocurrency sector, which saw its global market cap suffer a substantial loss of $350 billion, decreasing by 10.4% to $2.15 trillion by the end of the week.
Here are our picks for top cryptocurrencies to watch this week:
XRP breaks below bull pennant
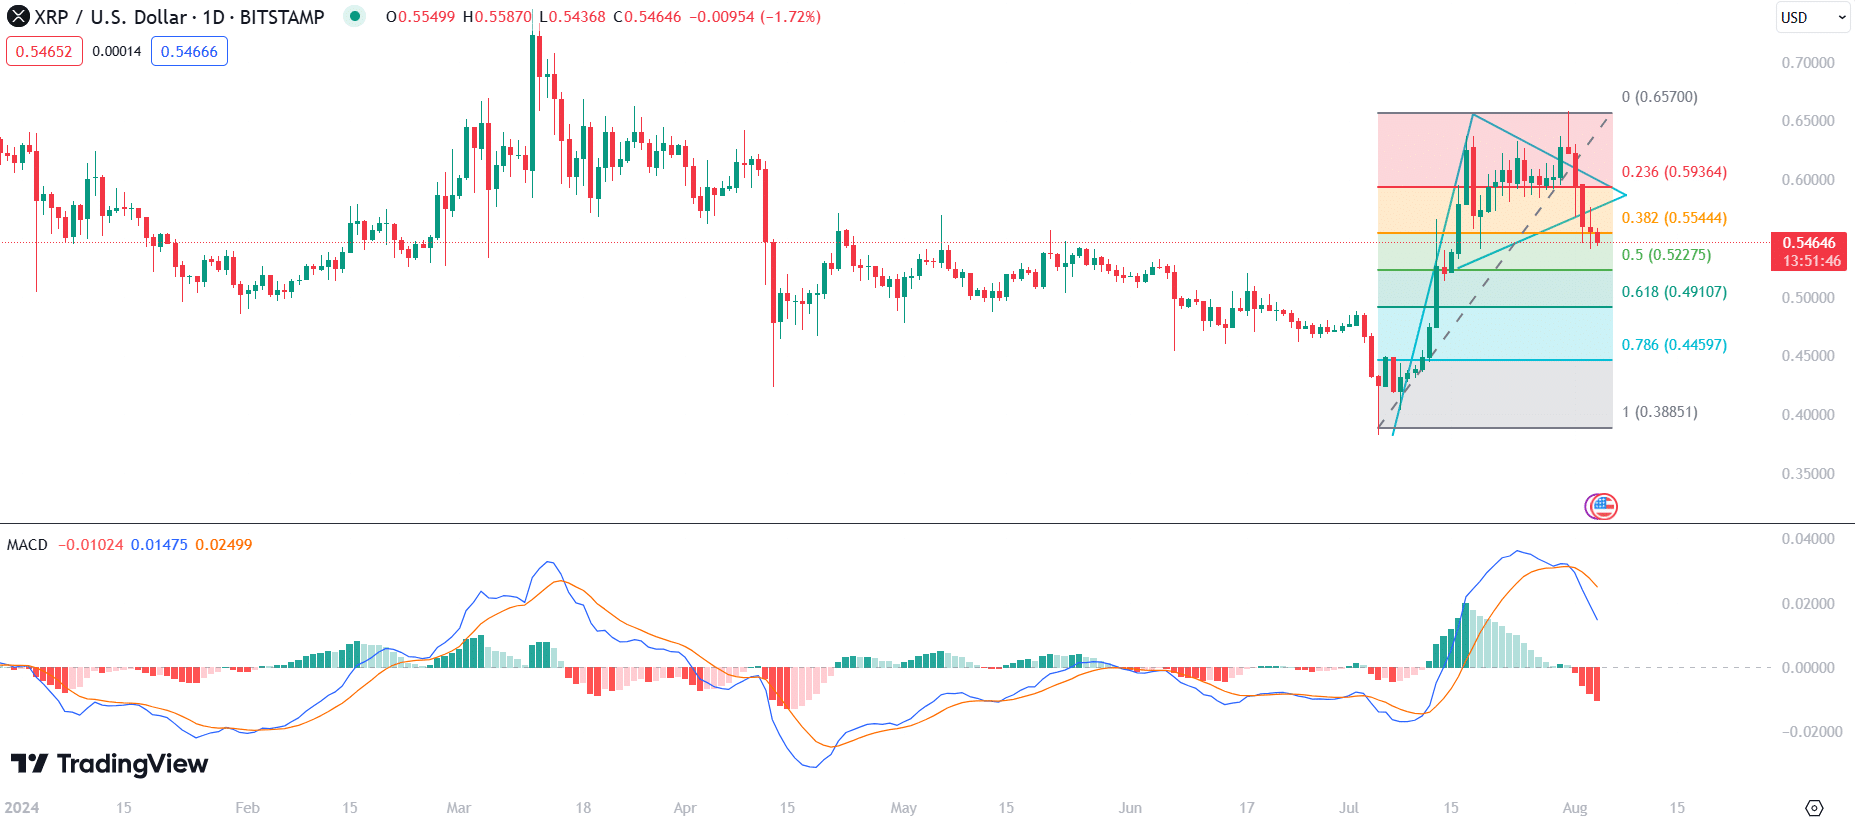
XRP (XRP) began the week with a bullish push to a four-month high of $0.6580 on July 31.
However, as the broader market collapsed, XRP corrected these gains. It had formed a bull pennant amid the consolidation from July 18 to 30.

The formation of the pennant had initially suggested a continuation of the July 7 to July 17 uptrend. Nonetheless, the asset broke below the pennant on Aug. 2 when it collapsed below $0.55, indicating a shift in momentum to bearish. Consequently, XRP ended last week with a 6.5% drop.
On the daily chart, XRP has moved below the 0.382 Fibonacci level at $0.5544. If bearish momentum continues, XRP could further decline to 0.618 ($0.4910), which would serve as its last defense against a drop to the early July values.
At this point, the 0.5 and 0.618 retracement levels are potential support zones. If the price can find support and stabilize at these levels, there may be a chance for a reversal. However, if bearish pressure persists, XRP could continue its downward trend.
TRX suffers double top declines
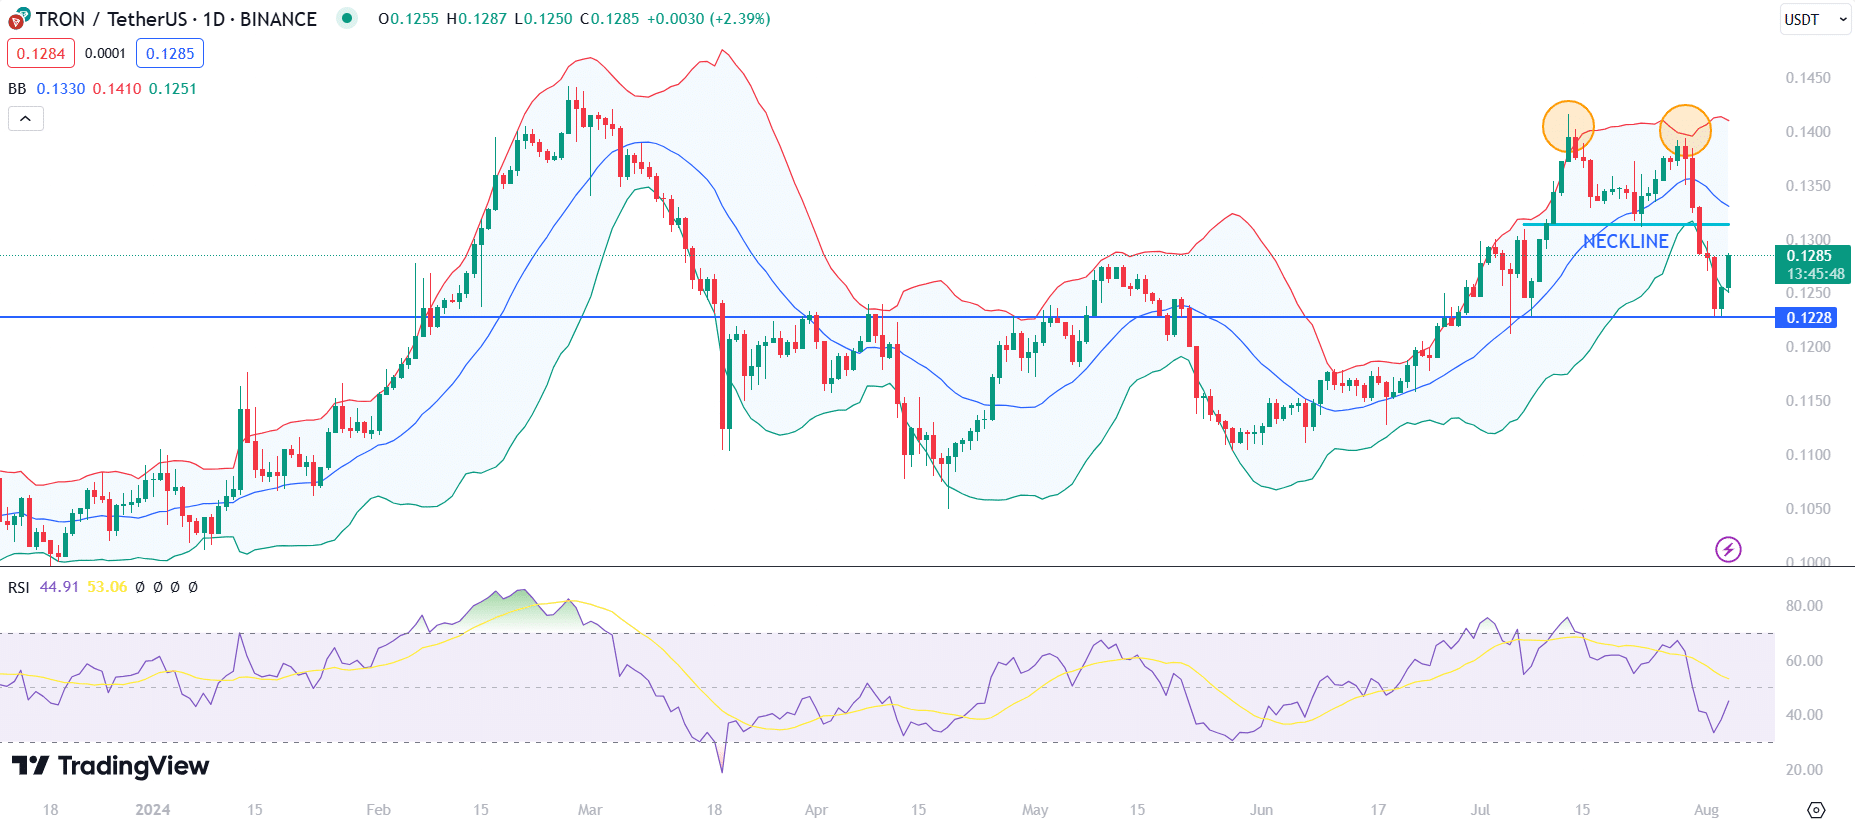
Tron (TRX) also started the week bullish, but its rise to a high of $0.1394 resulted in the formation of a bearish double-top pattern. This also coincided with a retest of the upper Bollinger Band ($0.1397), bolstering the imminent correction.

Following the formation of the double top, TRX broke below the neckline, confirming the pattern and resulting in a sharp decline to a three-week low of $0.1228. However, TRX found robust support at $0.1228 and is looking to recover.
The current recovery shows the price moving back toward the middle Bollinger Band, which acts as a short-term resistance around the $0.1330 level, representing the 20-day SMA.
Given the bounce from the support level at $0.1228 and the current price near $0.1285, it is important to watch if Tron can break above the neckline level again. Sustained trading above this level could indicate a reversal of the bearish trend and a potential move higher.
HNT slumps 18%
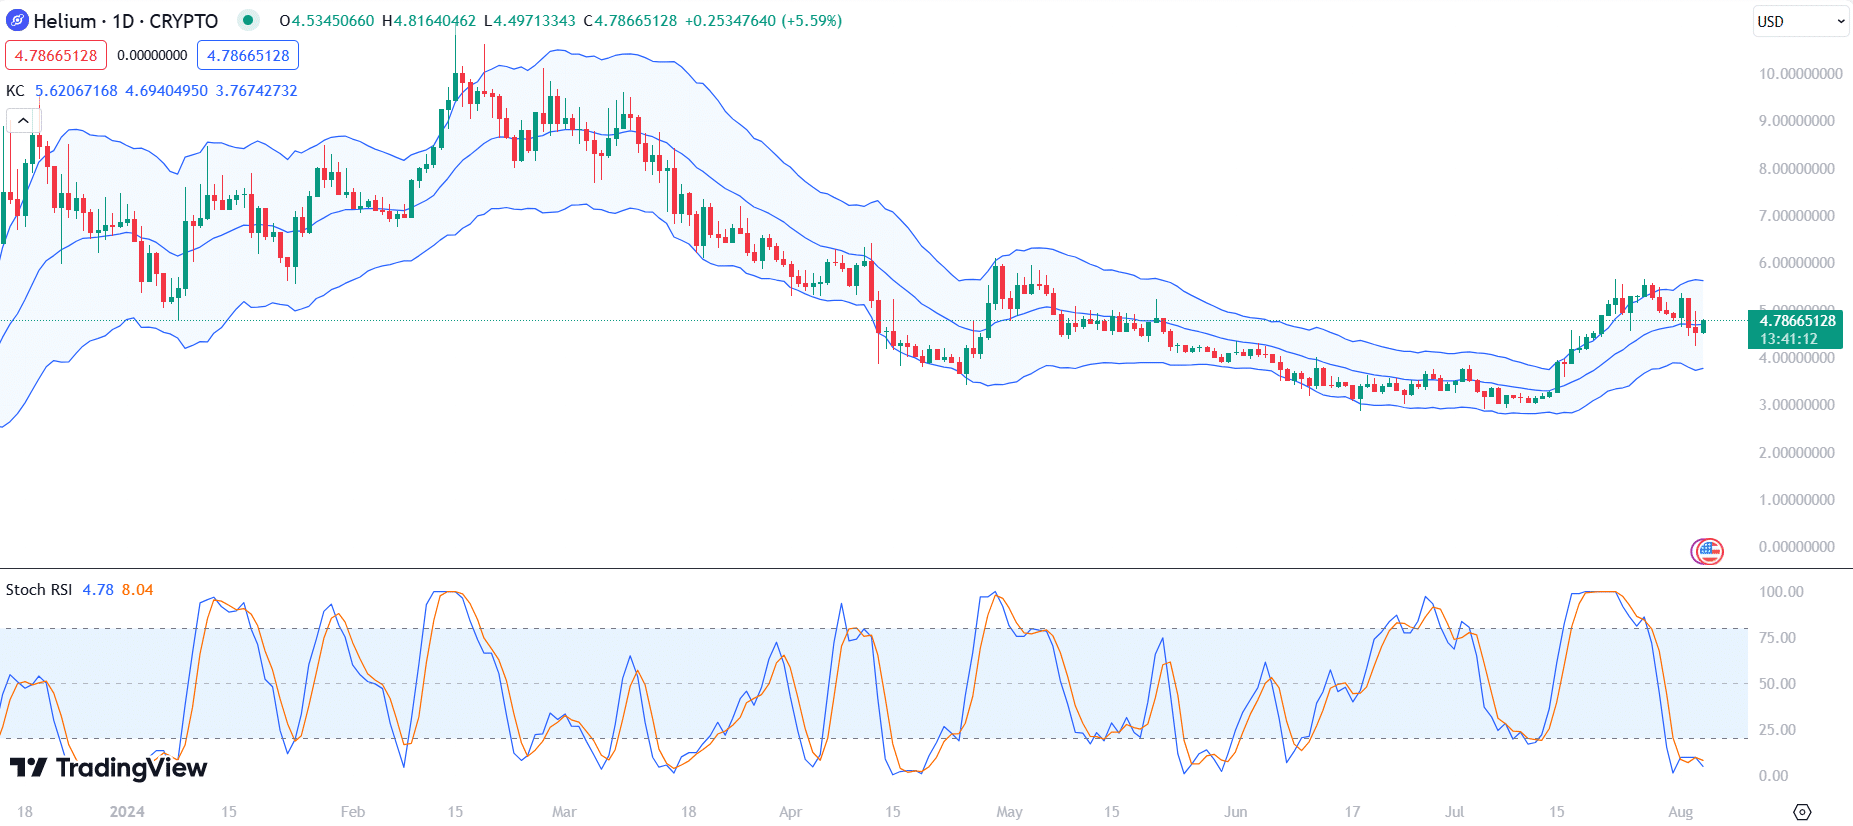
Helium (HNT) started last week on a bearish note, recording four consecutive days of declines. It staged an 8% intraday recovery gain on Aug. 1, but these gains were snuffed out by a subsequent 11.47% drop the next day.

HNT ended the week with an 18% slump. Moreover, chart data confirms that Helium currently trades near the middle line of the Keltner Channel (KC).
The Stochastic RSI, on the other hand, indicates that HNT is in oversold territory. The Stochastic RSI values are around 4.78 for the %K line and 8.04 for the %D line. This suggests that the selling pressure may be overextended, and a potential rebound could be on the horizon.
It is significant to watch for potential support around the middle KC line at $4.69. If Helium holds above this level and the Stochastic RSI begins to rise, it could indicate a buying opportunity.
However, a break below this level could lead to further declines towards the lower KC boundary at $3.76.
Conversely, if HNT can regain momentum and move towards the upper KC boundary, it would need to surpass $5.62 to signify a strong bullish trend.
