Economic Data Poised to Shape Fed Decision and Market Outlook
Kitco Commentaries
Opinions, Ideas and Markets Talk
Featuring views and opinions written by market professionals, not staff journalists.

As July draws to a close, investors and Federal Reserve officials alike are poised on the edge of their seats, eagerly awaiting two crucial economic reports that will shed light on the health of the U.S. economy. These reports, set to be released on Thursday and Friday, will provide pivotal information just days before the Federal Open Market Committee (FOMC) convenes for its July meeting.
On Thursday, July 25, the Commerce Department will unveil its first estimate of second-quarter GDP growth. Economists are forecasting an annualized growth rate of 2%, a significant uptick from the 1.4% recorded in the first quarter. This data will offer valuable insights into the economy’s resilience and trajectory.
Following closely on its heels, the Bureau of Economic Analysis will release the Personal Consumption Expenditures (PCE) inflation index for June on Friday, July 26. This report is particularly significant as the core PCE is the Fed’s preferred measure of inflation. Economists anticipate the core PCE, which excludes volatile food and energy
prices, to have risen by 0.10% on a monthly basis, a slight increase from May’s 0.08%.
On an annual basis, both headline and core PCE are expected to show a modest decrease in inflation, from 2.6% in May to 2.5% in June.
These reports will play a crucial role in shaping the Fed’s monetary policy decisions.
Currently, there’s a 93.3% probability that the Fed will maintain its benchmark interest rate between 5.25% and 5.50% at the upcoming July meeting.
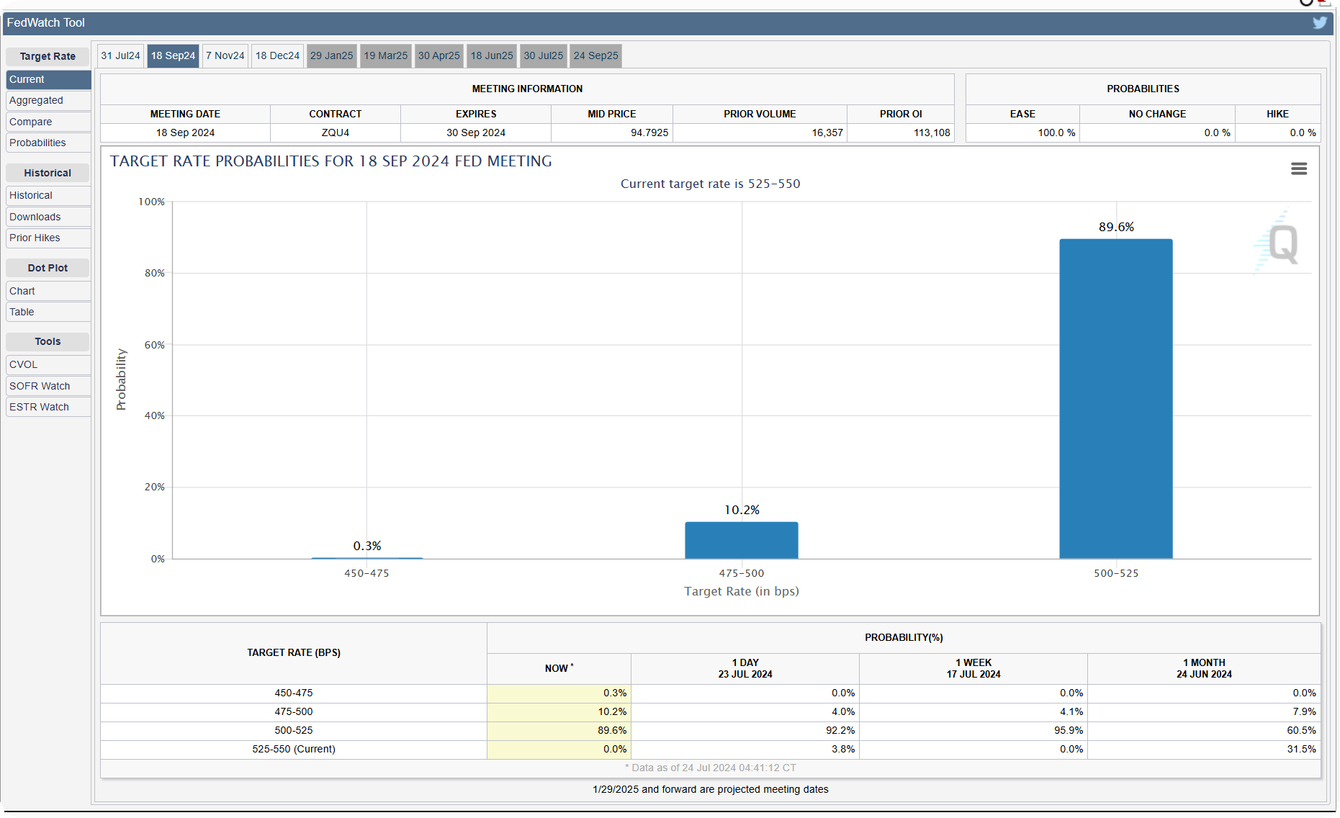
FedWatch Tool chart (PNG) for September

Investors are pricing in multiple scenarios for potential rate cuts in September. The CME’s FedWatch tool indicates an 89.6% probability of a 0.25% rate cut, a 10.2% chance of a 0.50% cut, and a newly added 0.3% possibility of a 0.75% cut. This last scenario would bring the Fed funds rate down to between 4.50% and 4.75%, signaling a significant shift in monetary policy.
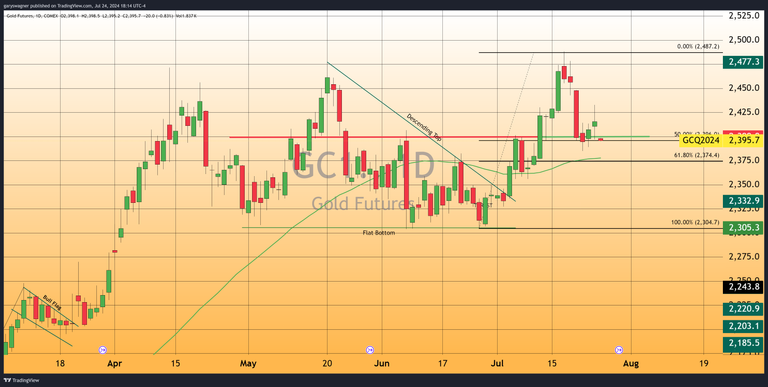
Daily gold chart

The anticipation of these reports and their potential impact on Fed decisions has already influenced financial markets. Gold futures, often seen as a hedge against economic uncertainty, have shown volatility. The most active August contract opened at $2,410.70, and reached a high of $2,433, before settling near the day’s low at $2,397.
As market participants and policymakers alike await these critical economic indicators, the coming days promise to be pivotal for the U.S. economic outlook. The interplay between GDP growth, inflation trends, and the Fed’s response will likely set the tone for financial markets in the months ahead.
For those who wish to learn more about our service, please go to the links below:
Information, Track Record, Trading system, Testimonials, Free trial

Gary Wagner
Gary S. Wagner has been a technical market analyst for 25 years. A frequent contributor to STOCKS & COMMODITIES Magazine, he has also written for Futures Magazine as well as Barrons. He is the executive producer of “The Gold Forecast,” a daily video newsletter.
He has been a speaker for financial seminars including Futures West and the Dow Jones Financial Symposium which travels throughout the world.. Coauthor of “Trading Applications Of Japanese Candlestick Charting” a John Wiley publication.

